The Fundamentals of Select
You’re a developer who stores data in PostgreSQL. You’re comfortable writing queries, perhaps making indexes.
But you’re UNcomfortable explaining why a query runs slow. You haven’t been to a formal PostgreSQL class since college, you don’t read query plans, you’ve never read the Postgres source code (and you don’t wanna.)
You just want to quickly learn:
- How queries use tables & indexes
- Where to look when a query is too slow
- What indexes exist on a table, and how they’re used
Let’s get started! You can either watch the video below, or keep reading – both methods cover the same concepts.
Meet the Stack Overflow users table.
In this class, like with all my training classes, I’m using the free Stack Overflow Postgres database. It’s built from StackOverflow.com‘s free public data dump with the contents of their database. I love using it for demos because it’s real-world data with real-world problems.
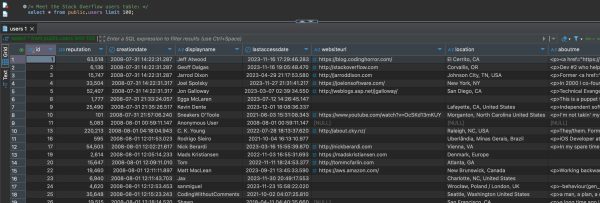
The users table holds exactly what you think it holds – and you can click on this to see the full size image:
There are columns for display name, website url, location, and more. Let’s say I’m looking for the people who live near me:
|
1 |
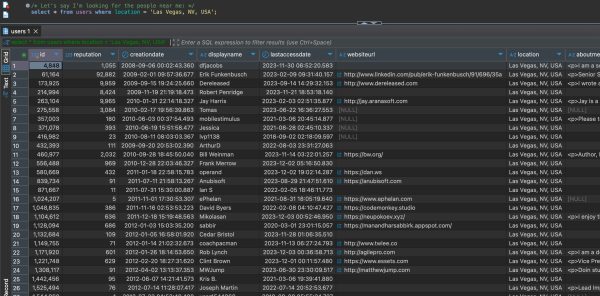
select * from users where location = 'Las Vegas, NV, USA'; |
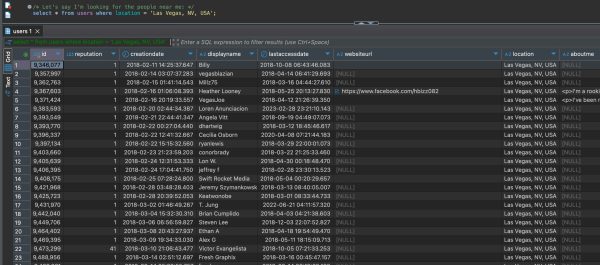
Run that query a few times, and you’ll notice that the order changes each time, with different users at the top of the result set each time. The above screenshot looks like it’s ordered by users.id ascending, starting with around 4,000, but run it again:
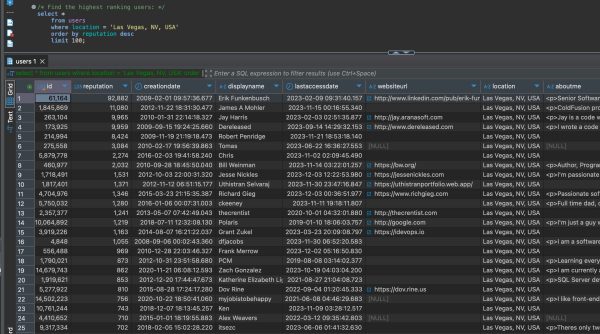
And a different set of users show up at the top. That’s because in Postgres, order isn’t guaranteed unless you put an order by on your query. Let’s fix that by finding the users with the best reputation scores in town, and just the top 100:
|
1 2 3 4 5 |
select * from users where location = 'Las Vegas, NV, USA' order by reputation desc limit 100; |
Run that a few times, and you’ll notice that it takes a second or two each time it runs. Why?
How to Find Out What a Query is Doing
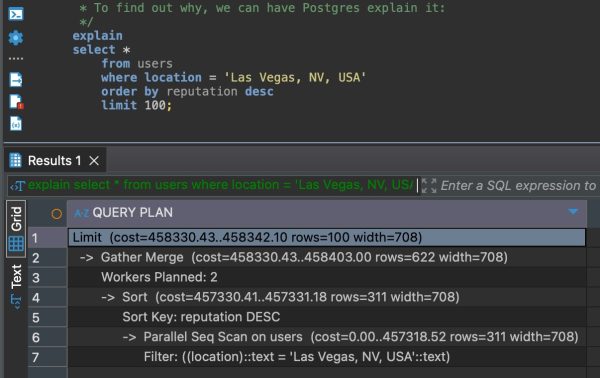
When you wanna find out what work a query is doing, you can ask Postgres to explain it for you. Just put the word explain before your query:
|
1 2 3 4 5 6 |
explain select * from users where location = 'Las Vegas, NV, USA' order by reputation desc limit 100; |
If you’re a Postgres guru, you might be comfortable reading those textual results. I’m a visual person, so I like plan visualizers. There are a lot of free ones out there, and at the moment, I prefer explain.dalibo.com, aka Dalibo’s PEV2.
Warning: anytime you paste anything into a web browser, you need to know whether that data is leaving your computer and going out to the internet. In the case of plan visualizers, your query and its plan may be posted publicly. If your query is private corporate material, or if it has things like client names or patient names as part of the query (think where clause parameters, for example), then you probably want to run the visualizer locally. Read the Github repo instructions on how – it’s really easy, just involves downloading a single HTML file locally.
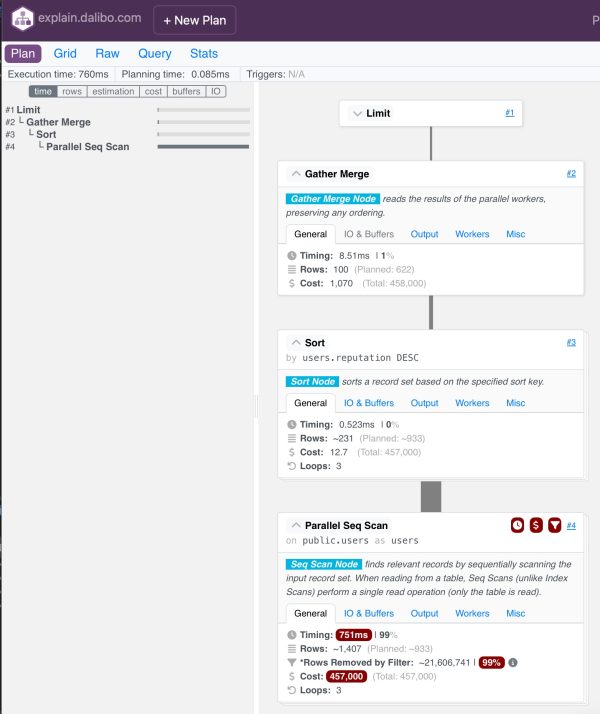
Here’s what a visual plan looks like with Dalibo’s PEV2:
Whoa! That’s awesome, and it’s a lot more detail with helpful icons pointing out where problems are. To get that level of detail, we need to run our query with a few more explain options:
|
1 2 3 4 5 6 |
explain (analyze, buffers, costs, verbose, format json) select * from users where location = 'Las Vegas, NV, USA' order by reputation desc limit 100; |
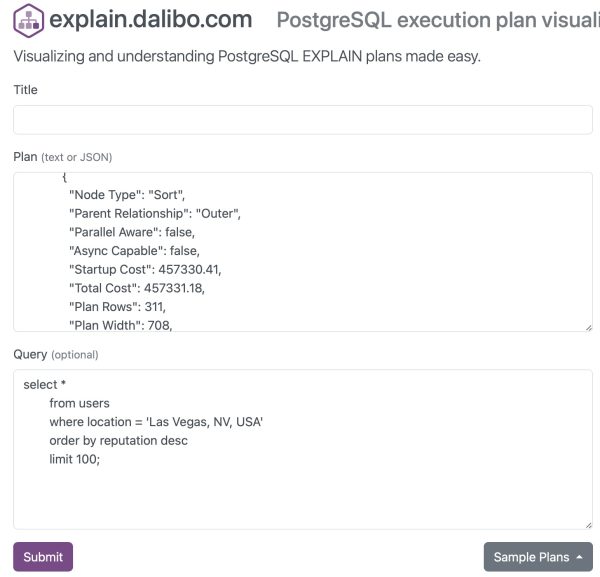
That’ll produce JSON that you can copy/paste out into explain.dalibo.com:
Click Submit, and you’ll get the visualized plan:
Click on the little down arrows on each rectangular operator on the right hand side to expand their details:
Reading the Explain Plan
When you’re troubleshooting a slow plan, look for the operators with warning icons:
- Clock: means Postgres spent the most time on this operator (doing this thing)
- $: Postgres thought this part would be the most expensive
- Funnel: Postgres read a ton of rows, but filtered most of them out, indicating that we’re reading more data here than we needed to read
In our query’s case, there’s one operator that has all three icons: the Parallel Seq Scan.
The explanation on there is pretty clear: Postgres is having to scan the entire table (public.users) in order to find the people who live in Las Vegas.
To understand why, we need to look at how Postgres actually stores data on disk.
How Postgres Stores & Reads a Table
By default, Postgres stores data in 8KB pages. Think of them as like pages of a spreadsheet, or pieces of paper, and they look like this:
You can download that PDF here, and as you go through the training courses here on the site, it’ll be useful to help understand why Postgres does what it does.
For simplicity’s sake here, I’m using an actual spreadsheet page. Postgres wouldn’t leave that much empty space on a page, nor would it organize the data into columns. After all, a row doesn’t cleanly fit left to right on a page – notice how a lot of stuff is cut off here, including the about. We’ll cover more details about data types in our other Fundamentals classes. For now, just think of the data as a page like the above screenshot.
The data looks like it’s sorted by the ctid column. The ctid is actually Postgres’s internal identifier: the first number (0) indicates the page number, and the second column (like 1, 2, 3, etc) indicates the row number on the page. (Yes, gurus, it’s technically a tuple number – but again, we’re keeping this simple for this class.)
The important part to note is that the table isn’t sorted by location. If we want to find the people who live in Las Vegas, we’re gonna have to scan the entire table, checking the location of each person to see whether they live in Las Vegas.
That’s why this operator is so expensive and time-consuming:
We had to read all 22 million of our users, and we filtered out 99% of them because they don’t live in Las Vegas. If we want this to go faster, we need a copy of our data sorted by location so we can jump straight to the Las Vegas folks.
How Postgres Stores Indexes
If we want a copy of our data sorted in another way, it’s up to us to create that copy. Here’s how:
|
1 |
create index users_location_reputation on public.users (location, reputation); |
I created that index on location AND reputation because when I jump to Las Vegas, I want those users already sorted by reputation, because my query is asking for the top-ranked reputation folks. Let’s get that sorting out of the way in the index.
Creating the index takes a minute or two because Postgres is literally reading the entire users table, writing out all of the locations & reputations, sorting them, and writing the sorted copy to disk. When it’s done, Postgres has created another data structure that looks like this:
An index really is another copy of the table, but you get to choose which columns are used for the sorting, and which columns are included in the 8KB page.
One column you can’t choose, and is included regardless, is that magical hidden ctid that we mentioned earlier. When Postgres finds an interesting row in the index, like one of those people who live in Las Tunas, Cuba, then Postgres has to be able to jump over to the table itself to find the rest of the columns for that row. Like, what are those people’s names who live in Las Tunas? To do that, it reads the ctid from the index, and then jumps to that particular page number and row number on the table itself.
Now that I have the index, how does my query perform?
How Postgres Reads Data From Indexes
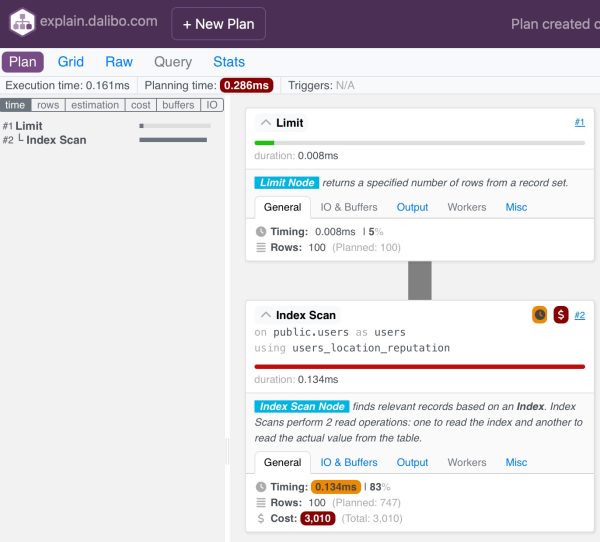
After the index is created, the query runs nearly instantaneously. Before, it was taking about a second, but now, look at the execution time (at the top left) on the new explain plan after we paste it into Dalibo:
The query now runs in less than a millisecond. People probably wouldn’t bring us this query calling it “slow”, but as long as we’re here, let’s look at the new explain plan for its differences.
The old plan’s slowest operator (the parallel seq scan) had 3 icons: a clock, a $, and a filter. The filter icon is gone now because we’re not reading extra rows. Postgres used the index – note the “Index Scan” operator says “using users_location_reputation.” It didn’t have to scan the entire table to find the people who live in Las Vegas – it just dive-bombed into Las Vegas and only read the rows that matched. No filtering was involved.
Postgres didn’t only use the index, however, because our query asked for all of the columns. Our index doesn’t have all the columns. That’s why the “Index Scan Node” note on the visualizer says that the index scan actually performs 2 read operations: one from the index (aka the black page of our PDF), and one from the table (the white page.)
The new plan doesn’t have a sort because the data in the index is already sorted by location, then reputation. When we jump to the people in Las Vegas, we can jump to the last one and read backwards from the highest-ranking reputation to the lowest. You can see that if you click the Misc tab of the Index Scan:
Note the “Scan Direction” = Backward. Once Postgres dive-bombed into Las Vegas, it could jump to the last row and scan backwards until it found the first 100 rows that matched.
Indexes Make Queries Go Faster. Check Yours.
Indexes are pre-sorted copies of your table to help queries run more quickly.
If you don’t have any indexes, then Postgres is going to end up scanning your whole table looking for the data that matches your query, and then sorting that data. That’s especially problematic as you pile more joins onto your query. Joins need data sorted in order to merge the data from multiple tables together.
Wanna find out what indexes exist on a table? Check out check_indexes:
|
1 |
select * from check_indexes('public', 'users'); |
The results:
Check_indexes is a free, open source function we provide as part of the Smart Postgres Bag of Tricks. It lists the table itself, its indexes, and their sizes.
The ordinary table is 2.8GB, and our index on location & reputation is another 188MB. The more indexes you have:
- The larger your database becomes
- The slower your inserts/updates/deletes go, because Postgres has to maintain all those copies of the data at the same time
- The longer your backups & restores take
- The longer your vacuum & analyze maintenance processes take
But, on the plus side, indexes make your queries go faster.
It’s tempting to add an index every time your query is slow, but it’s a balancing act. The first few indexes produce great results, so don’t be afraid to add a few indexes to help as many queries as possible. However, just don’t go adding indexes on every column, because you’ll end up with new problems on inserts/updates/deletes.

