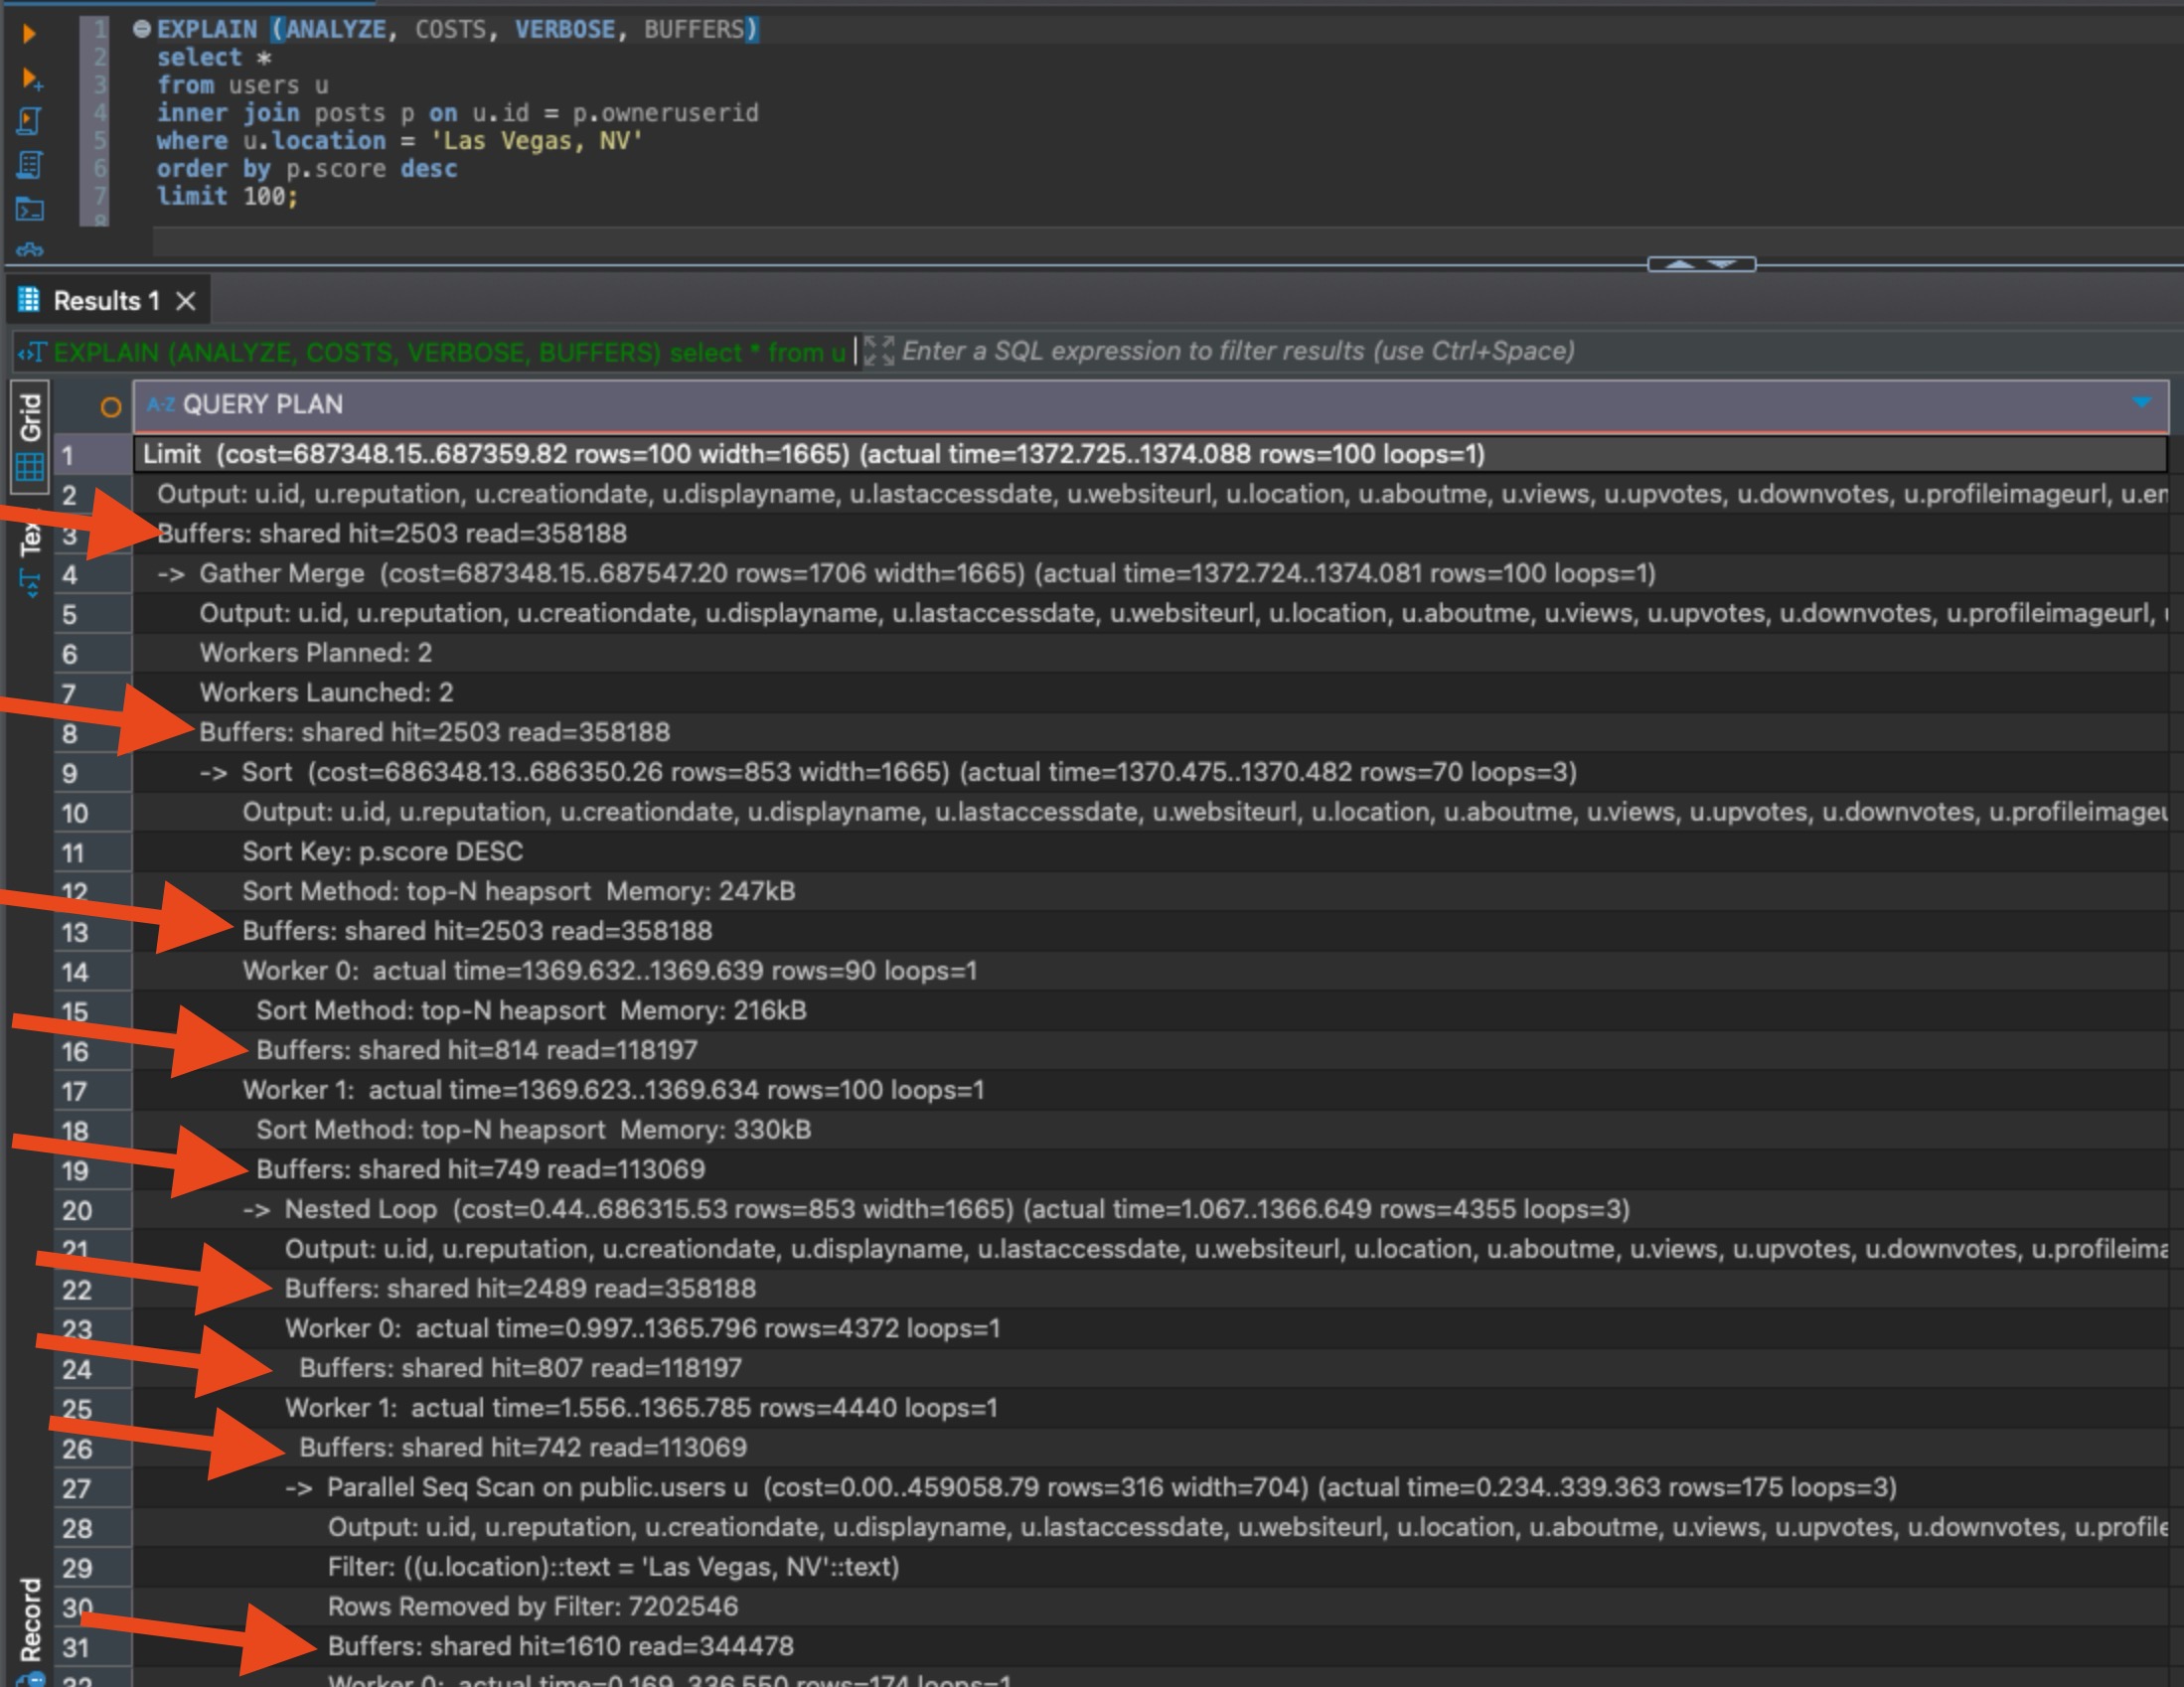
You’re tuning a Postgres query and you’ve been told to run EXPLAIN with the BUFFERS option, like this:
|
1 |
EXPLAIN (ANALYZE, COSTS, VERBOSE, BUFFERS) |
But the output like this is confusing, because the numbers don’t add up vertically or horizontally. It’s just a whole mess of numbers that seem unrelated:
Here are the questions I had when I first started reading plans:
Which buffer lines should you look at?
If you’re tuning the whole query, look at the top buffers number. It’s the total overall for the entire query.
If you’re trying to figure out which part of the query to tune, you could look at which buffers line (other than the total) has the highest numbers, but really, the better way to do this is to use a free plan visualizer like Dalibo or Depesz. Those tools can build a grid of your plan to see which portions have the highest buffer numbers, quickly:
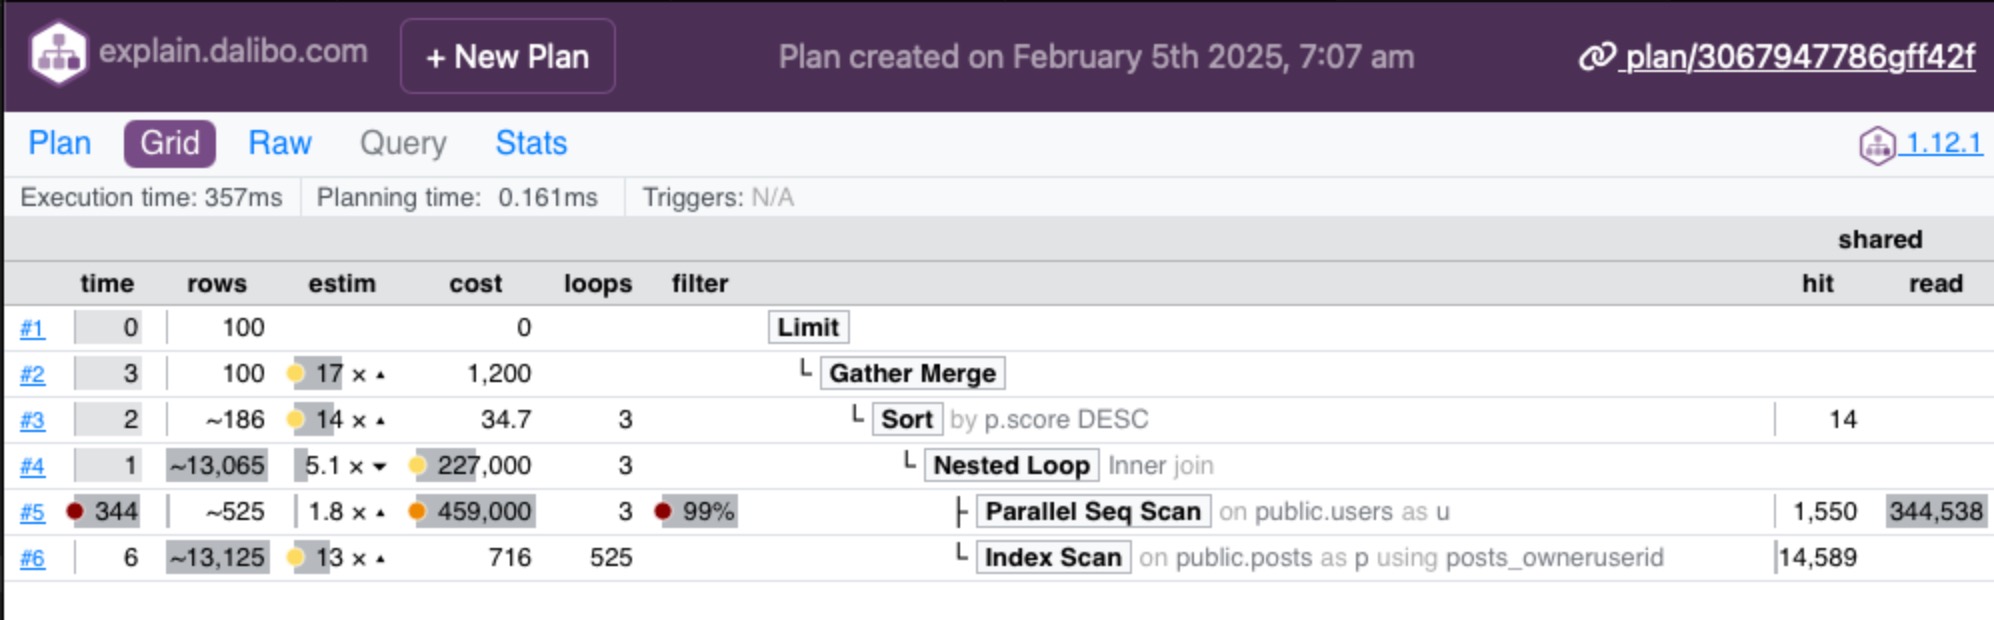
In that above example, I pasted the plan in and clicked the Grid button at the top left, and then looked at the Shared numbers on the right side. The operation with the biggest numbers is the one doing the most reads, and if you’re tuning to reduce storage reads, that’d be the table to look at. In this case, my operation on “public.users” is doing a scan, meaning that table may need an index.
If your query has parallel operations, you’ll see multiple rows of buffer outputs for the same operation, like this:

In this example, line 13 is a total for an operation that Postgres decided to parallelize across two workers, Worker 0 and Worker 1. Each worker’s buffers are shown individually, and line 13 adds ’em up. Well, not exactly: line 13 also includes the work done by the leader background process that coordinated the parallel query. That’s why the total buffer numbers for this parallel operation can be higher than the individual workers.
Should you look at shared hit or read numbers?
Shared hit = pages that Postgres got from cache. (By default, Postgres pages are 8KB, so you can multiply these buffer numbers by 8KB to get a rough idea of how much data is involved.)
Read = pages that had to be read up from storage because they weren’t in cache. (Also 8KB by default.)
I really wish Postgres just added those two up for a total on each line. I also really wish I could have six-pack abs without having to work out, but here we are. Mai Tais are just too tasty, and working out is hard. Back to databases.
In a perfect world, you’d probably add up both the hit & read, and focus on that total.
Some folks will tell you to only focus on the “read” numbers because those were much slower, since we had to get ’em from disk. However, if you re-run the same query repeatedly during tuning, you’ll notice that these numbers keep changing, and the “shared hits” number keeps going up, and the “read” keeps going down. That’s because the more you’re running the same query over and over, the more likely it is that your data is still going to be fresh in cache.
Some folks will tell you to clear the cache in between each run, but I don’t think that’s a great idea on shared servers. Plus, it doesn’t match up with real-world usage where some of your data really will be cached at any given time.
So me personally, I add up the numbers for shared hit + read, and work off the totals.
Why do the numbers keep changing?
In production, the most common reason is that other people are doing inserts/updates/deletes against the same tables you’re working with, but odds are that’s not the cause when you’re doing isolated performance tuning.
When you’re tuning, the most common reason by far is that when you repeatedly query a table, its data is more likely to be up in cache as opposed to be read up from disk. That’s by far the most common reason in dev environments.
Other less-common reasons: autovacuum kicks off by default every 60 seconds, and may be cleaning out dead tuples and reducing the amount of 8KB pages associated with a table or index. (That’s not entirely true, but I gotta keep things short here for a blog post. For more details, check out my Fundamentals of Vacuum training class.)
Another less-common (and less concerning) reason would be that Postgres may balance parallel query work differently from execution to execution, resulting in different numbers per worker thread.
What buffer numbers are good or bad?
Is 1000000 shared hits good or bad? Depends on the table size. Forget buffers for a second and let’s think conceptually.
If a query needs to read all 100% of your table, that’s kinda bad. It means we don’t have an appropriate index for our query, or our query is written in a way that it can’t use an index, or Postgres decided the index wouldn’t be the most efficient way to access the table.
If a query reads MORE than 100% of your table, that’s really bad. That probably means Postgres produced an inefficient query plan, or the query is really poorly written, and Postgres read the same data over and over.
If a query reads way LESS than 100%, that’s good. It probably means Postgres used an index to dive in and just grab the data that it needed. It means your query was well-written, and Postgres produced a good plan. Generally, the lower percent of the table that Postgres needed to read – say 1% or 0.1% of the table – that means even faster performance.
In a perfect world, the EXPLAIN BUFFERS output would tell us what percentage of the table was read for the query. In that perfect world, you would already be retired and sipping Mai Tais on the beach. This is not that perfect world, so it’s up to you to:
- Add shared hits + reads into one number
- Multiply that number times 8KB to get the total amount of data read from that table
- Compare that to the size of your table
If it’s 100% or above, you’ve got some work to do. The lower it is, like 1% or below, the better you’re doing.
Related reading:
- An introduction to buffer analysis by Will Jessop – his technique for reading the numbers and making iterative improvements to a query and indexes to reduce reads.
- How nested loops inflate buffer numbers by Lukas Fittl – if your query produces a nested loop join, then as Postgres hits the same cached page over and over, the cached hit numbers will go up for each repeated read, but Lukas says that’s not necessarily a problem. (I’d say it still is a problem, but we’d both agree it’s much less of a problem than reading from disk.)
- Local, dirtied, and write buffers – to keep this blog post simple, I focused on the read buffers for user tables, which is what most of y’all are looking at when you’re doing query and index tuning. There are other kinds of buffers, like local buffers for temp tables. These are left as an exercise for the reader.
2 Comments. Leave new
[…] Brent Ozar busts out the calculator: […]
I had to learn what is Mai Tais 🙂
Great post